Technical Analysis for Crypto CFD Trading: How to Read Price Charts and Indicators
Introduction
Online Forex trading platforms and Contracts for Difference (CFDs) allow individuals to trade on the foreign exchange market and other financial markets. These online platforms provide access to various financial instruments and allow for convenient, real-time trading from anywhere with an internet connection. Crypto CFDs trading is a popular investment opportunity for those looking to benefit from the cryptocurrency market’s volatility. Technical analysis is crucial for traders to make informed decisions in the crypto CFD market. With technical analysis, traders can identify trends, support and resistance levels and predict future price movements. This article will provide a guide on how to read price charts and use indicators for technical analysis in the CFD market.
Price Charts
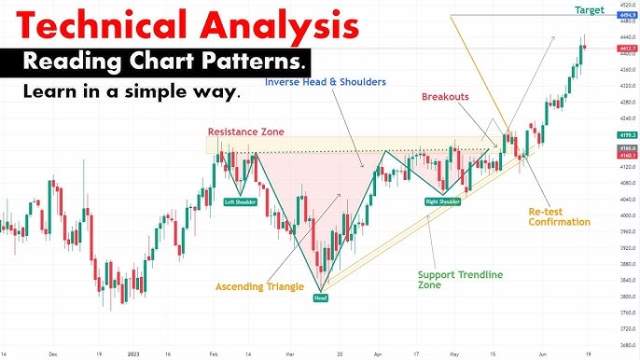
Price charts are the backbone of technical analysis. They provide a visual representation of the price movements of a cryptocurrency CFD over a specified period. Traders can use price charts to identify trends, support and resistance levels, and predict future price movements. Traders can use several types of price charts, including line charts, bar charts, and candlestick charts.
Line Charts
Line charts are the simplest type of price chart. They show the closing price of a cryptocurrency CFD for each time period, and these points are connected to form a line. Line charts are useful for getting a general idea of the price trend but provide little detail.
Bar Charts
Bar charts provide more detail than line charts. Each bar represents the price range of a cryptocurrency CFD for a specified time, with the top representing the high price and the bottom representing the low price. A vertical line within the bar represents the closing price. Bar charts are useful for identifying price ranges and trends.
Candlestick Charts
Candlestick charts are the most popular type of price chart among traders. They provide a wealth of information about the price movements of a cryptocurrency CFD. Each candlestick represents a specified period of time and consists of four parts: the body, the wick, the shadow, and the tail. The body represents the difference between the opening and closing prices, with the colour indicating whether the price went up (usually represented by a green or white body) or down (usually represented by a red or black body). The wick, shadow, and tail provide additional information about the high and low prices during the specified period. Candlestick charts are useful for identifying trends, support and resistance levels, and potential reversal patterns.
Indicators
In addition to price charts, traders can use indicators to help with technical analysis. The price of a CFD and/or its volume is used to calculate indicators. They provide additional information about the market, such as trend strength, momentum, and volatility. There are many different types of indicators, each with its purpose and use. Some popular indicators include moving averages, Bollinger Bands, and the Relative Strength Index (RSI).
Moving Averages
Moving averages are a simple indicator that smooths out price movements over a specified time. Traders can use moving averages to identify trends and potential areas of support and resistance. There are two main types of moving averages: a simple moving average and an exponential moving average. Simple moving averages add up the closing prices for a specified number of periods and divide them by the number of times. Exponential moving averages give more weight to recent prices.
Bollinger Bands
Bollinger Bands are a volatility indicator that consists of a moving average and two standard deviation lines. The distance between the lines varies based on market volatility, with the lines moving closer together during low-volatility periods and further apart during high-volatility periods. They can be used to identify potential trend reversals and trend strength.
Relative Strength Index
The Relative Strength Index (RSI) is a momentum indicator that measures whether a cryptocurrency CFD is overbought or oversold. The RSI is calculated using the average gains and losses over a specified period and is displayed as a line on a scale of 0 to 100. A reading above 70 indicates that a CFD is overbought and may be due for a price correction, while a reading below 30 indicates that it is oversold and may be due for a price increase.
Conclusion
Technical analysis is a crucial tool for traders in crypto CFDs. Traders can use price charts and indicators to identify trends, support and resistance levels, and predict future price movements. However, it is important to remember that technical analysis does not guarantee future price movements, and traders should always use caution and consider other factors, such as market news and events, when making trading decisions. With the right approach and a good understanding of technical analysis, traders can increase their chances of success in the CFD market.